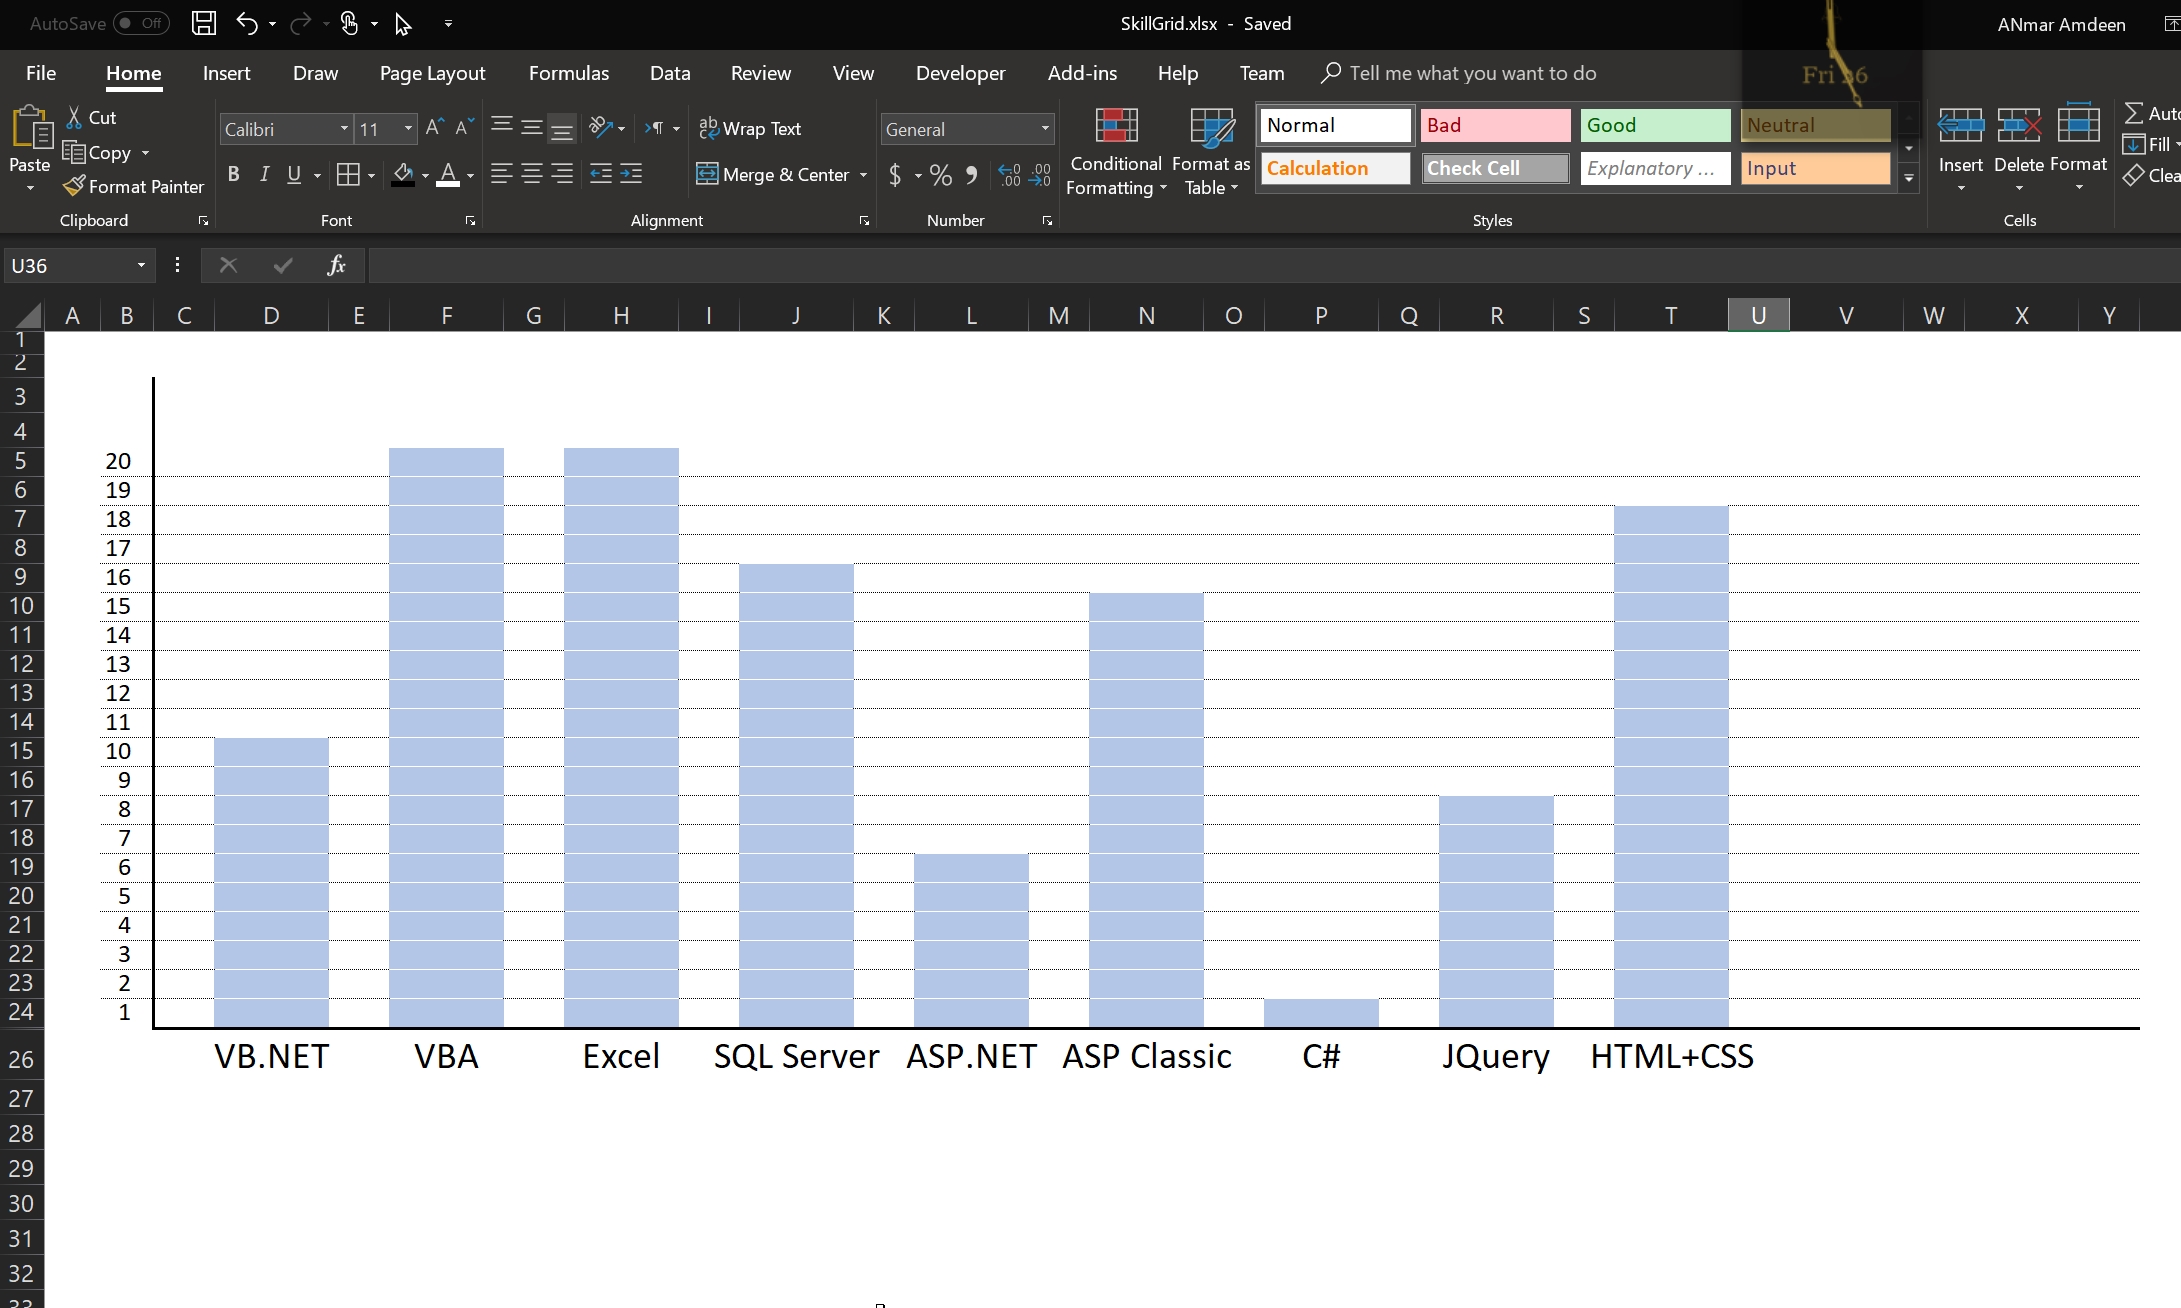
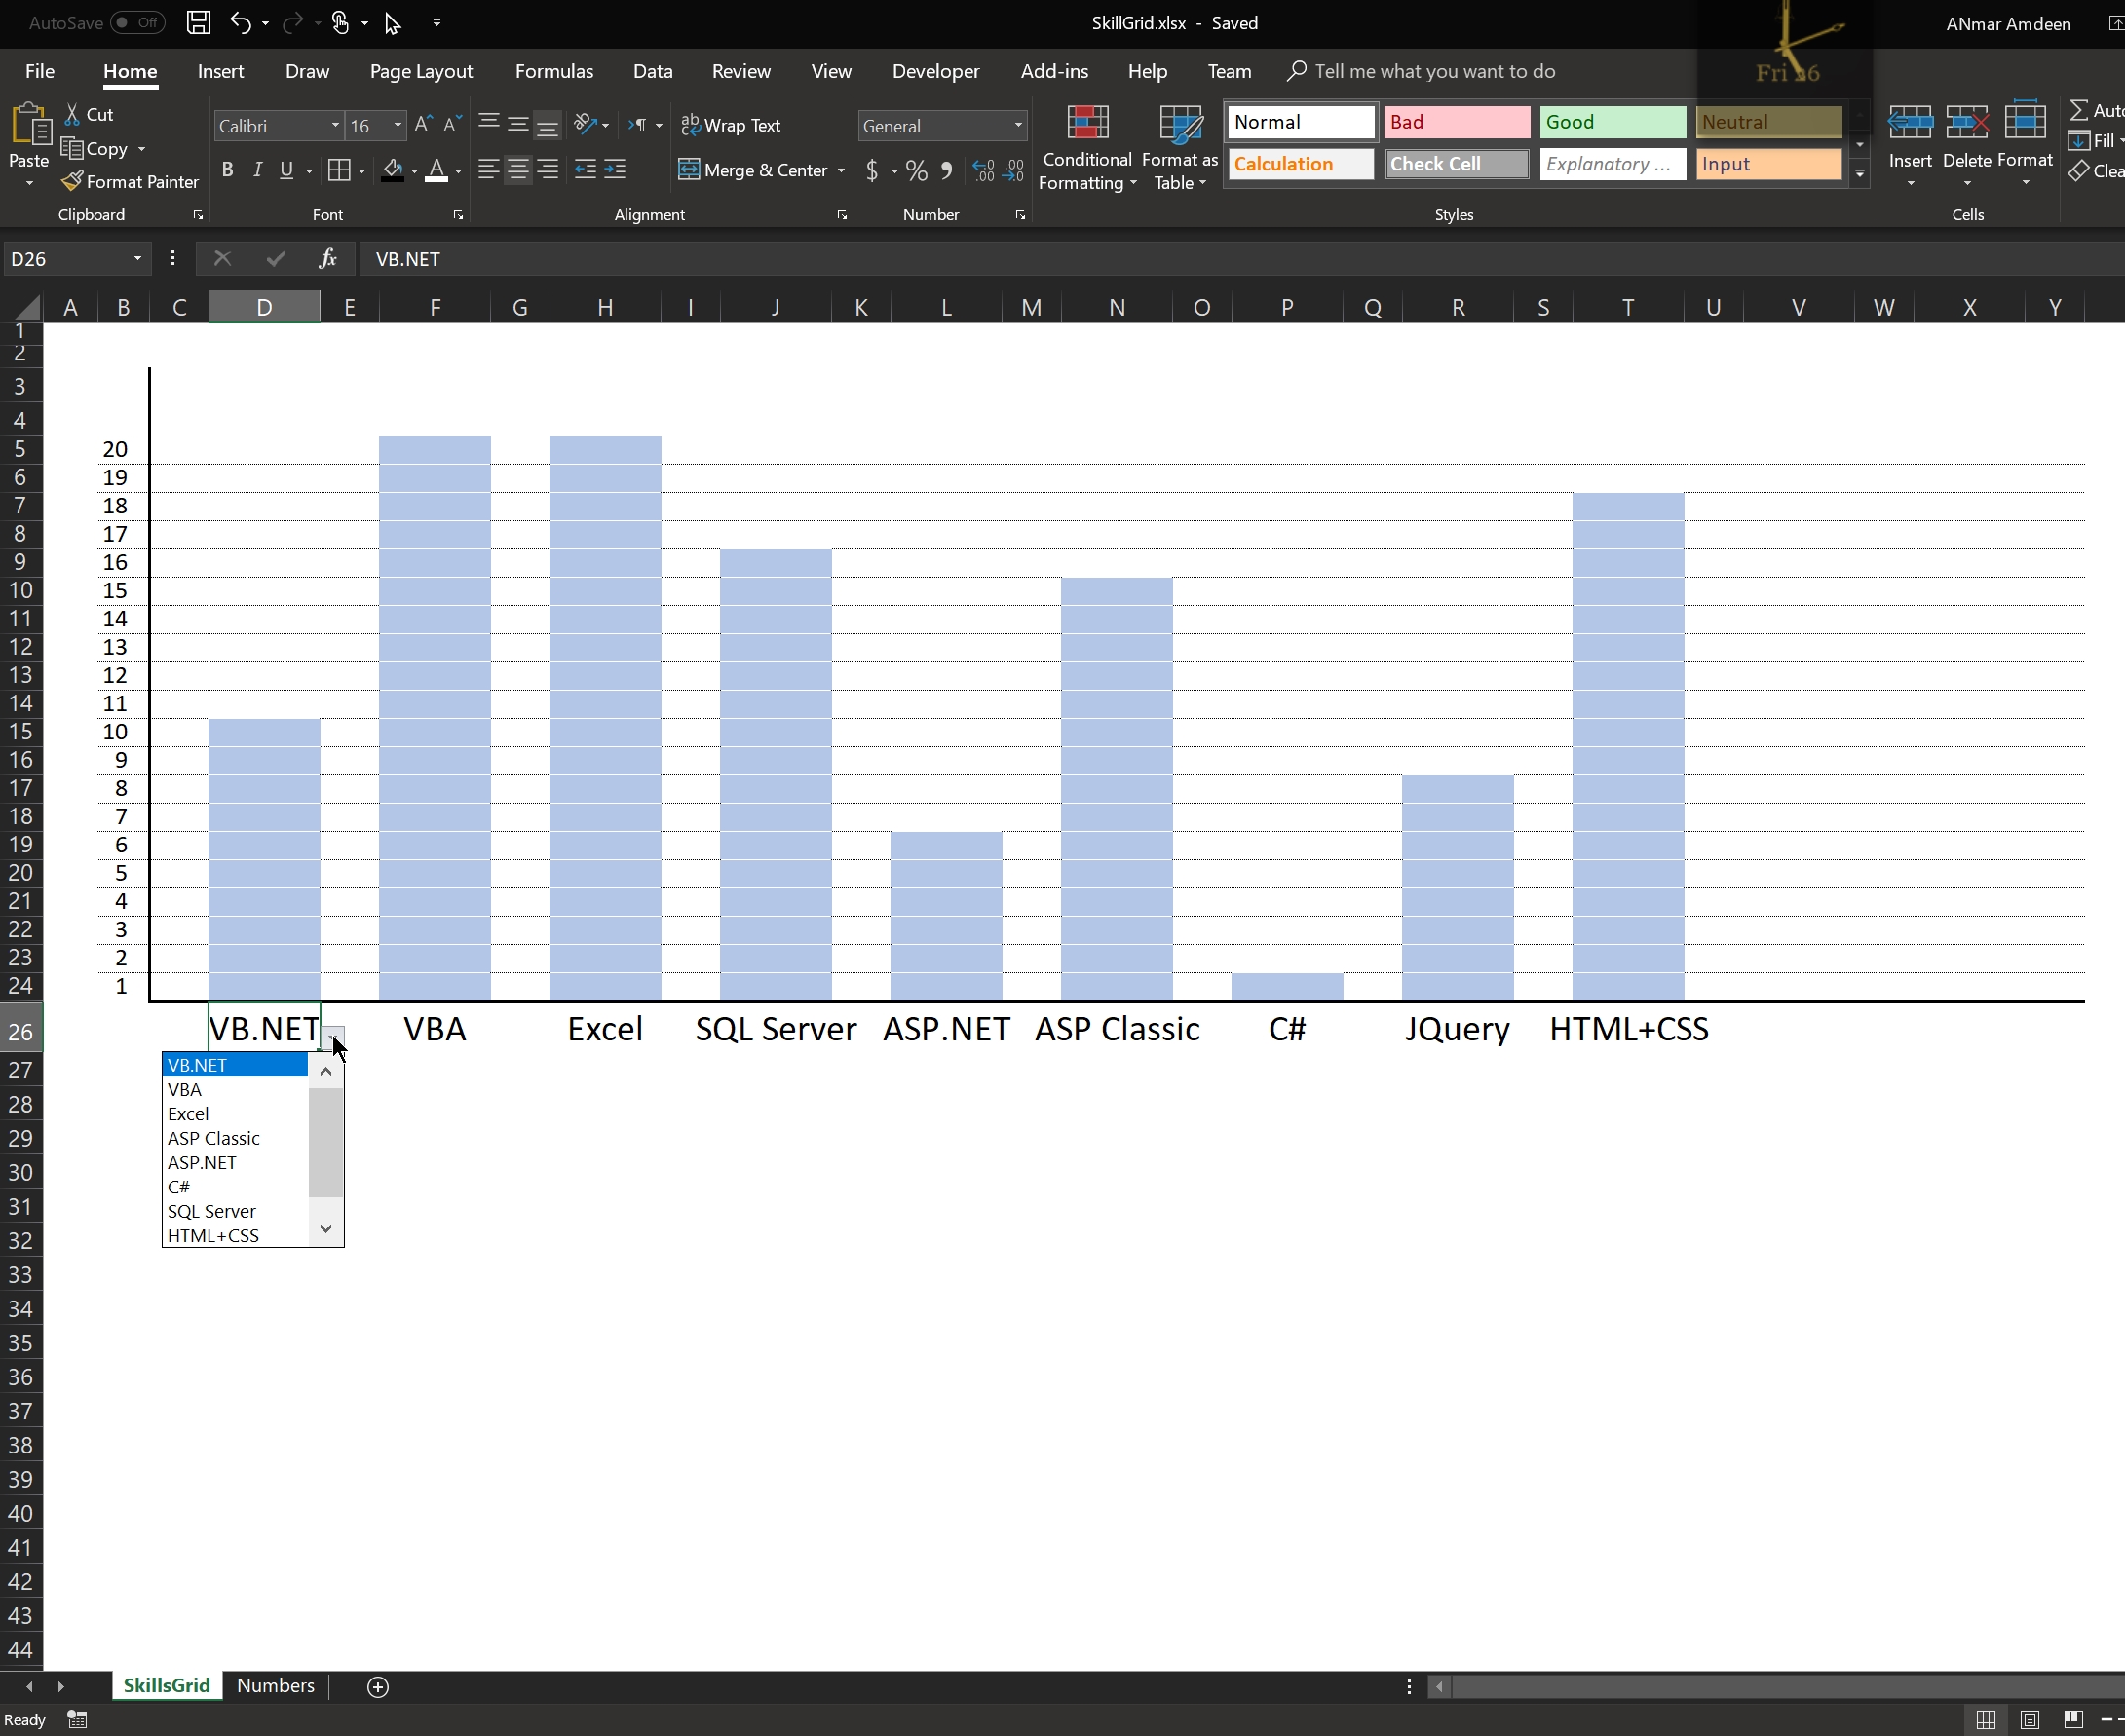
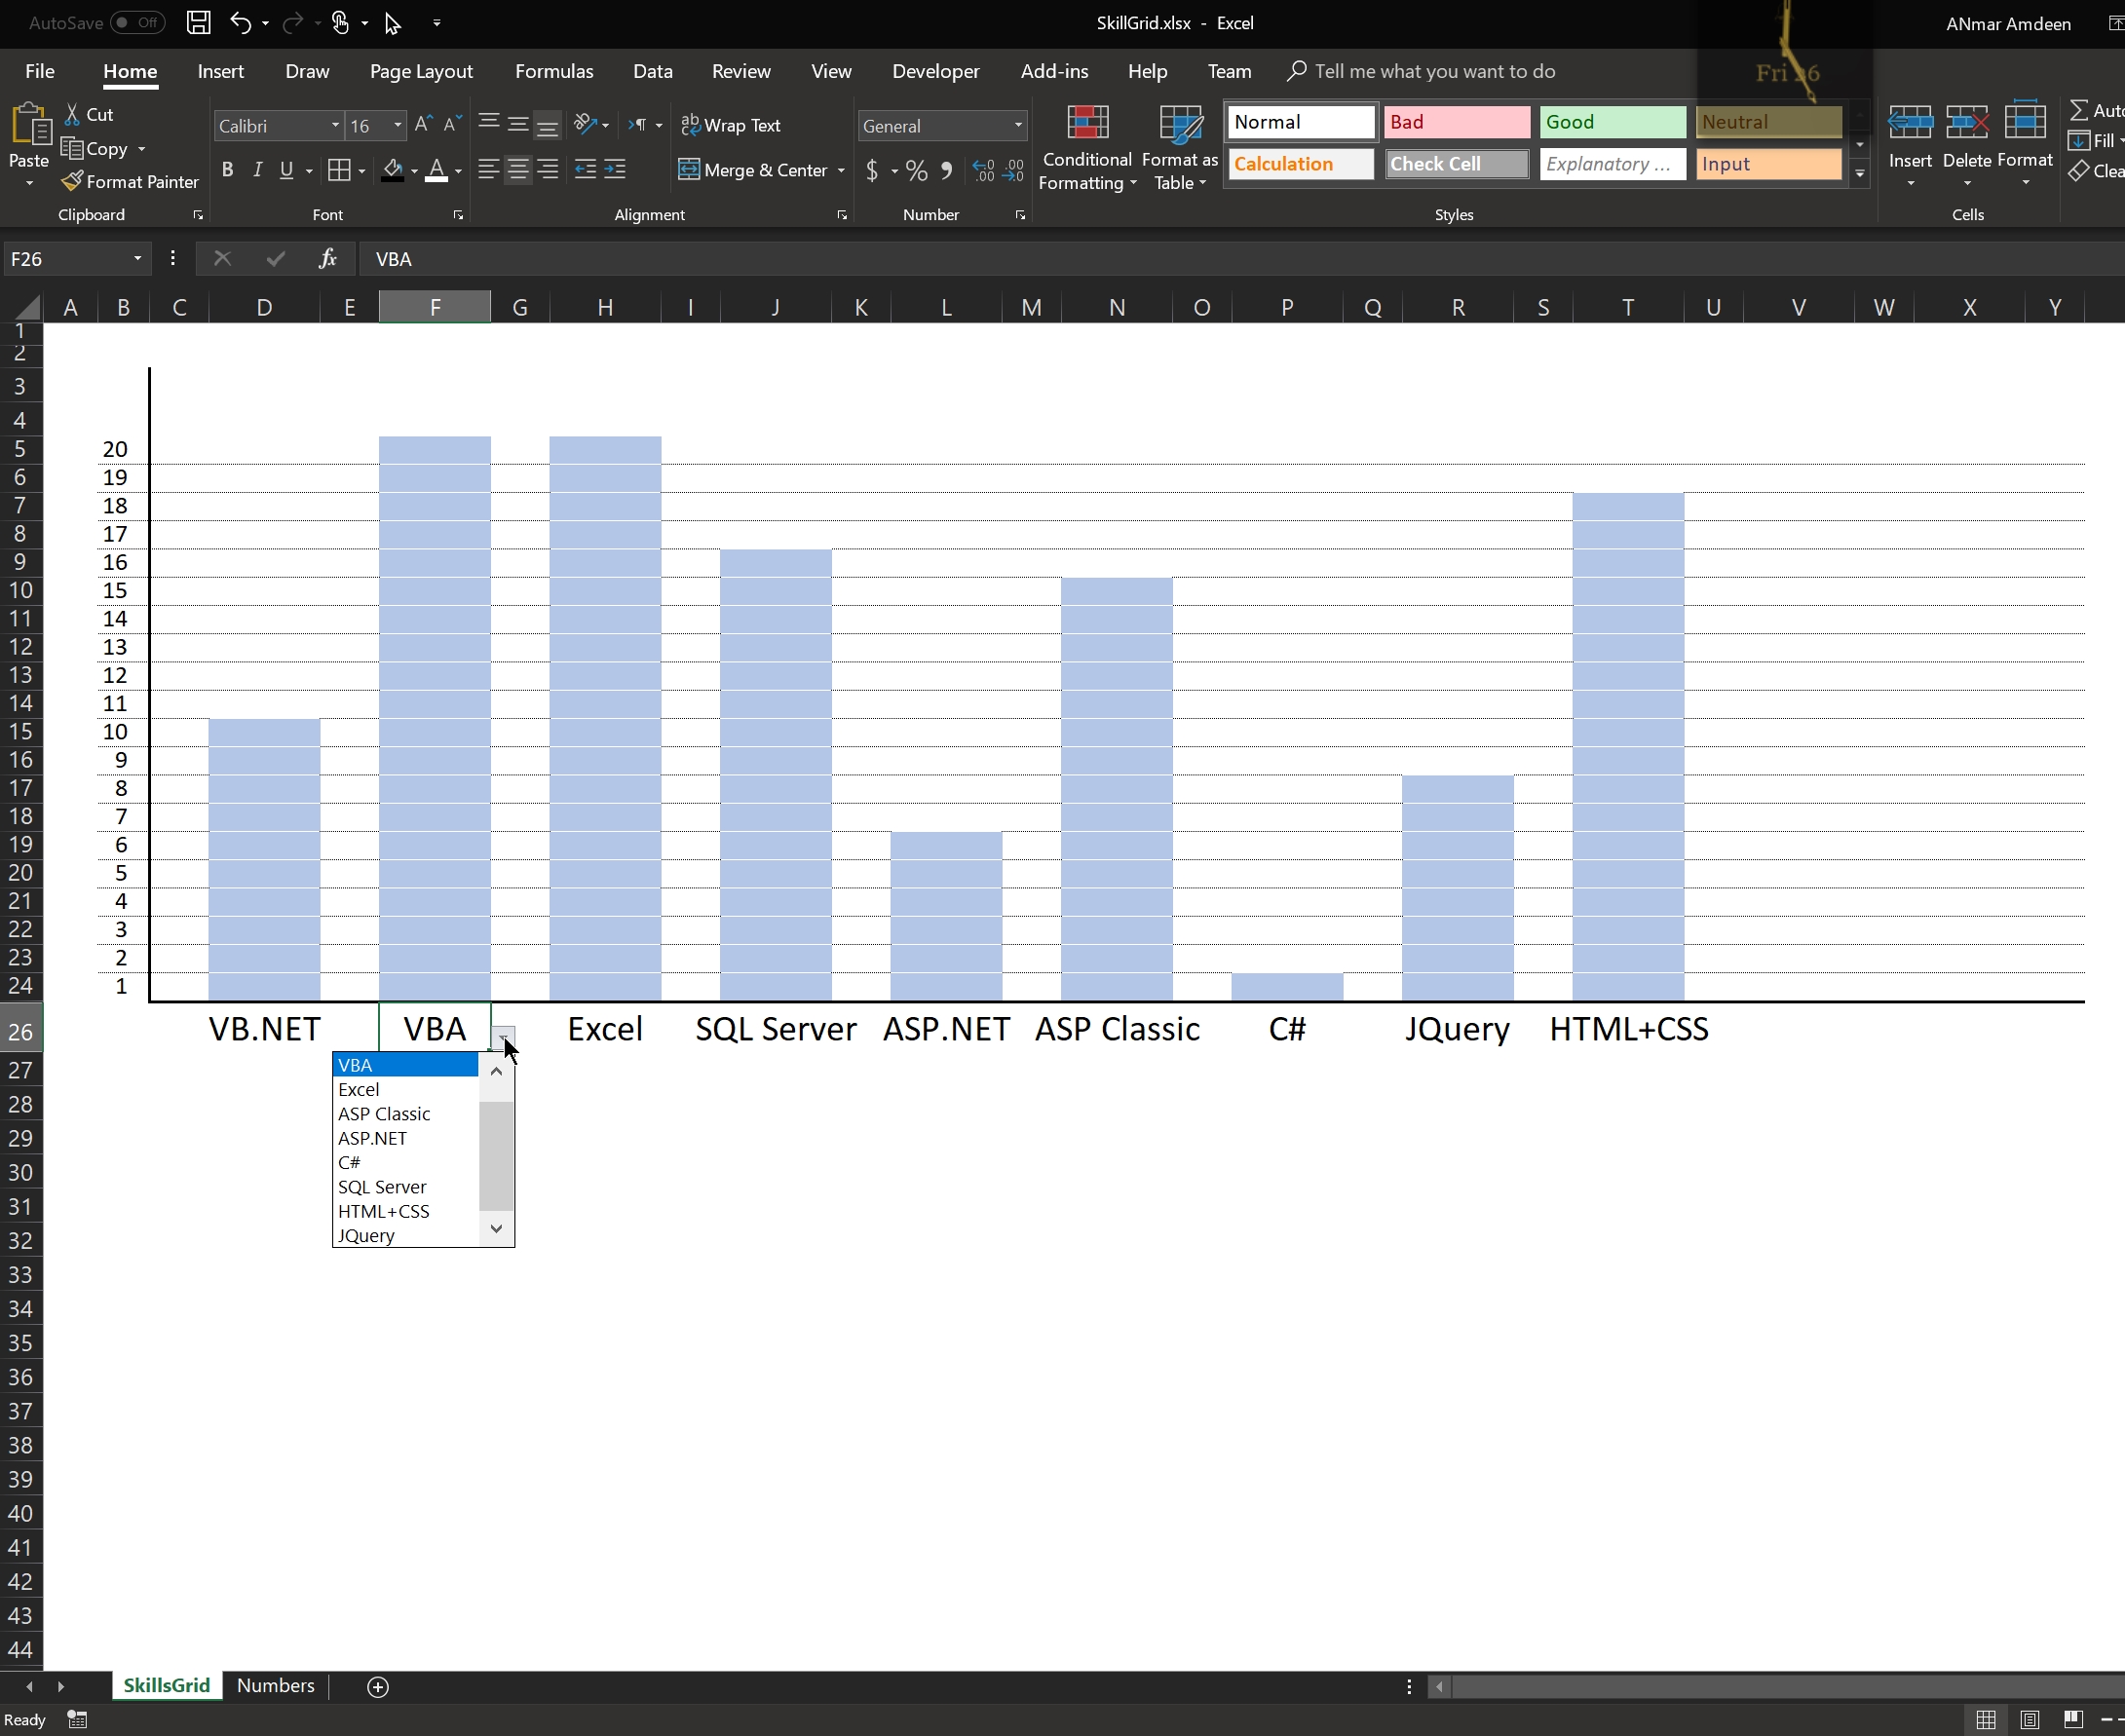
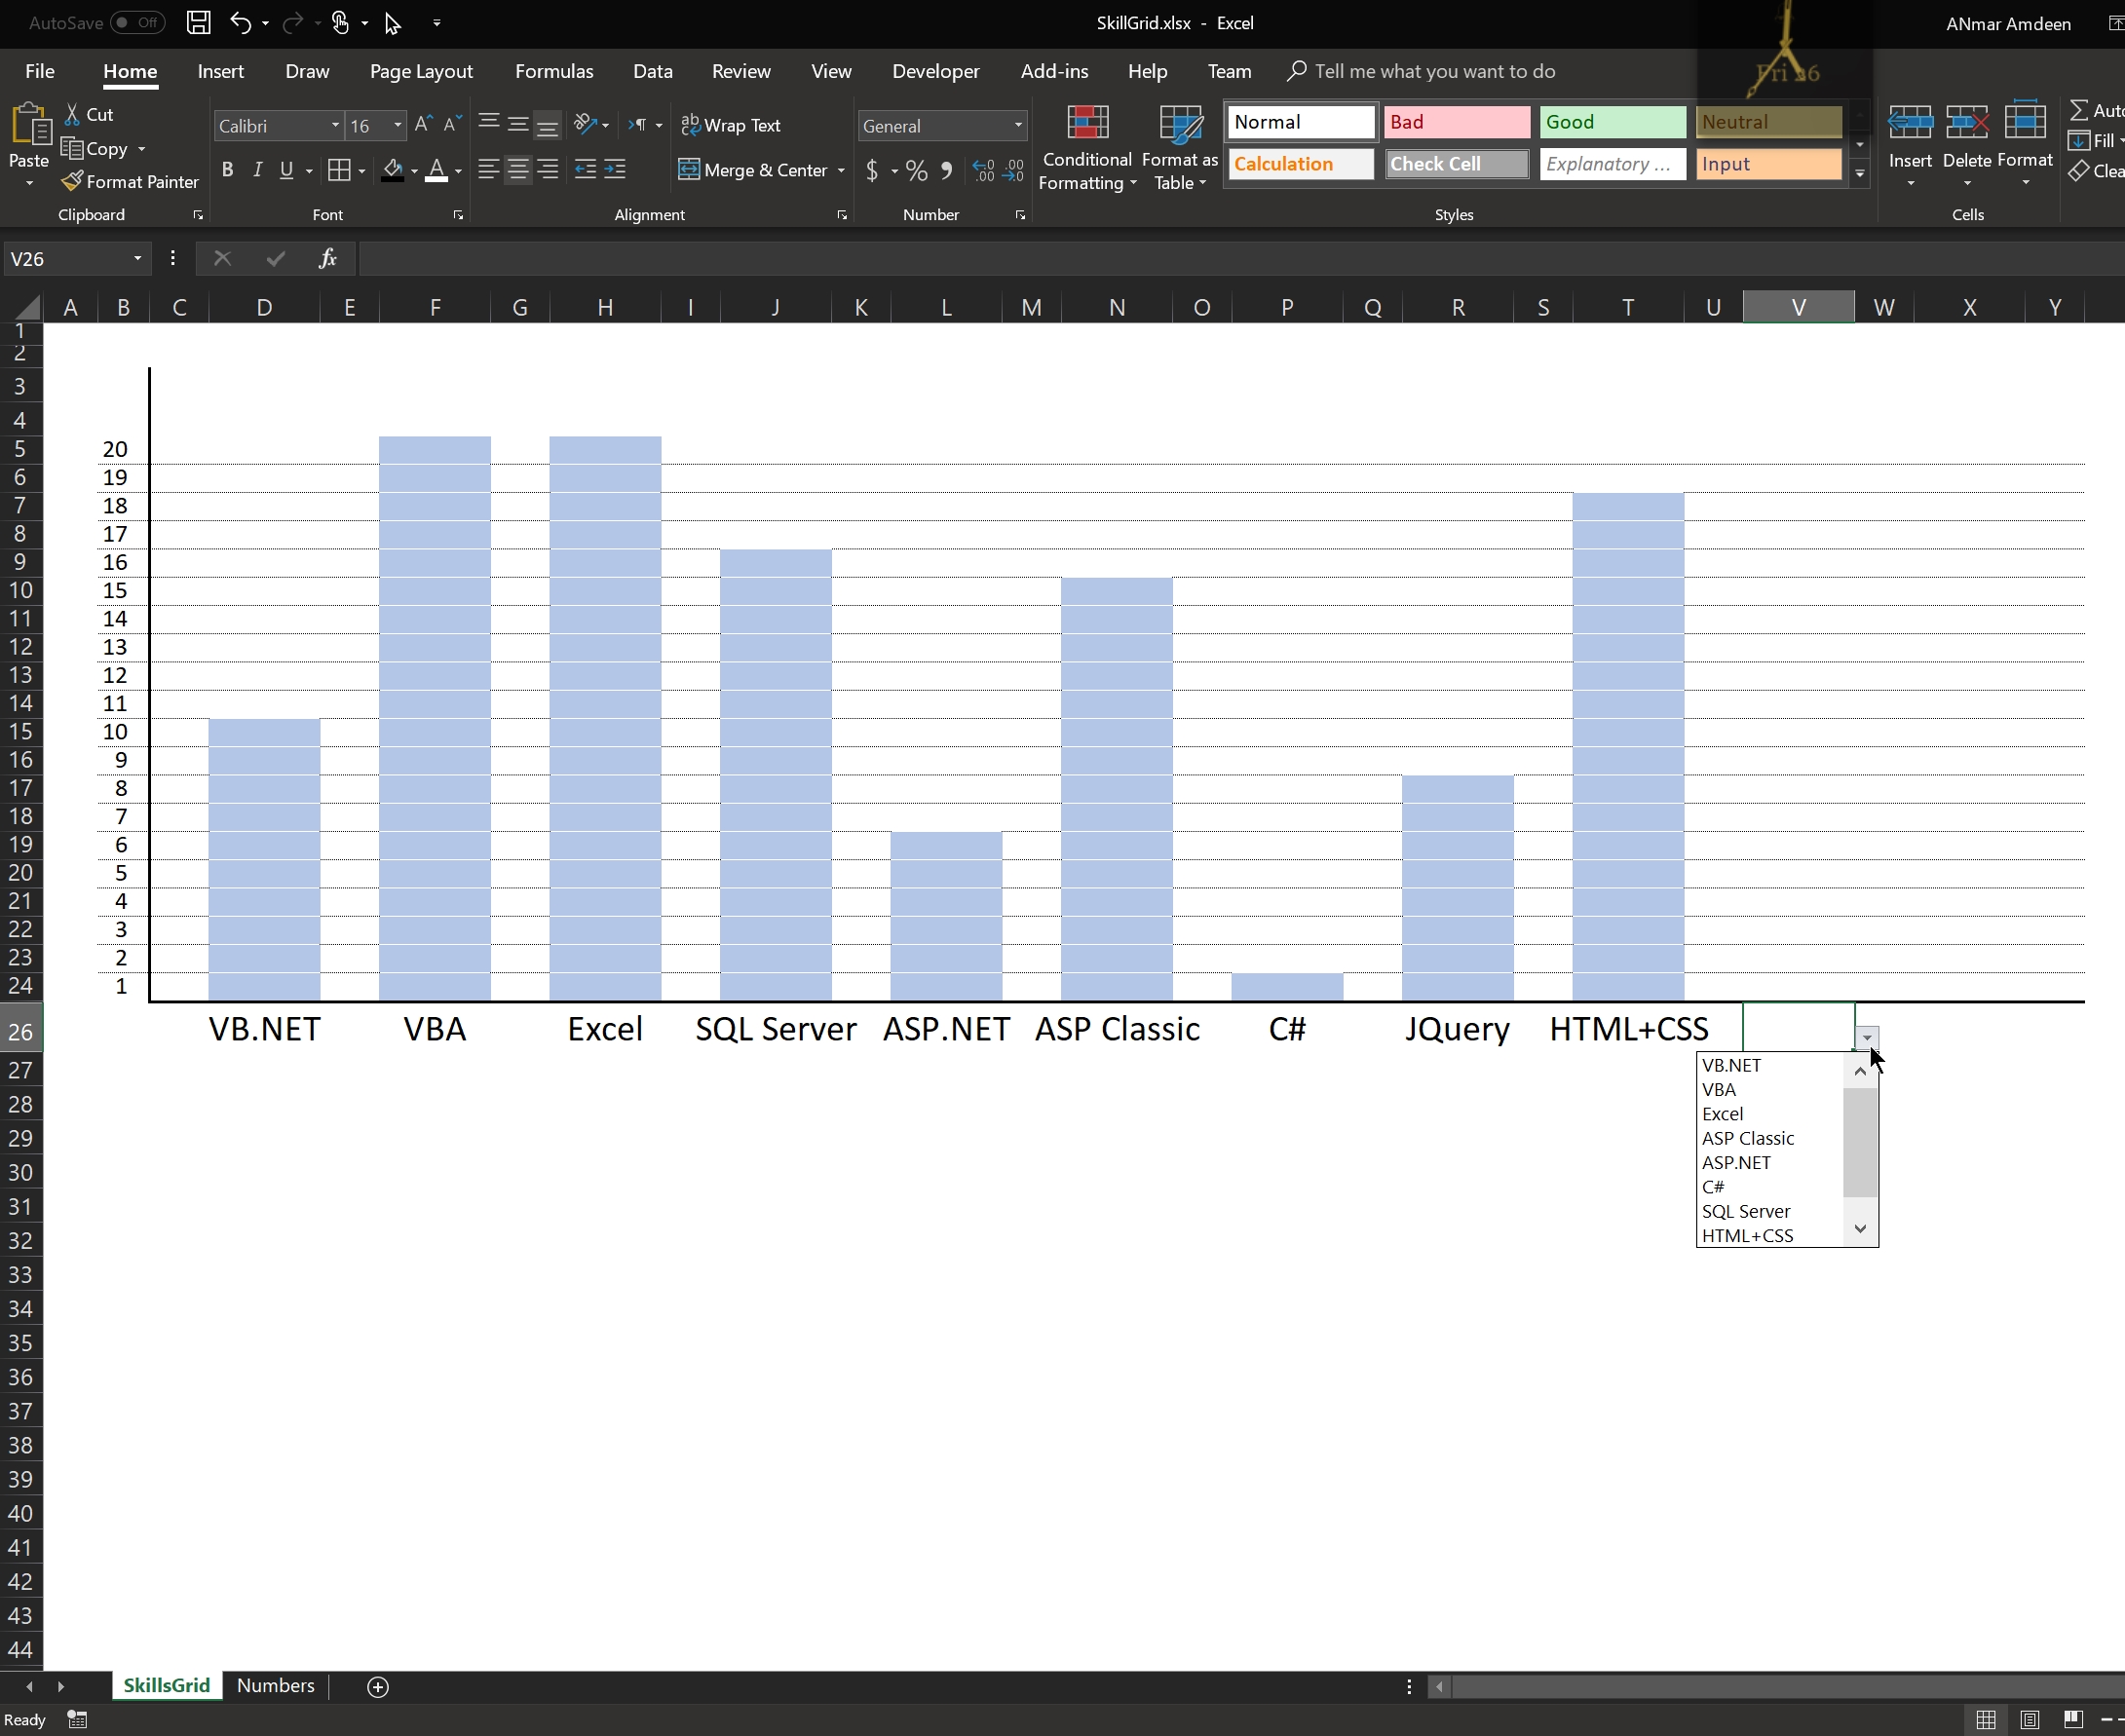
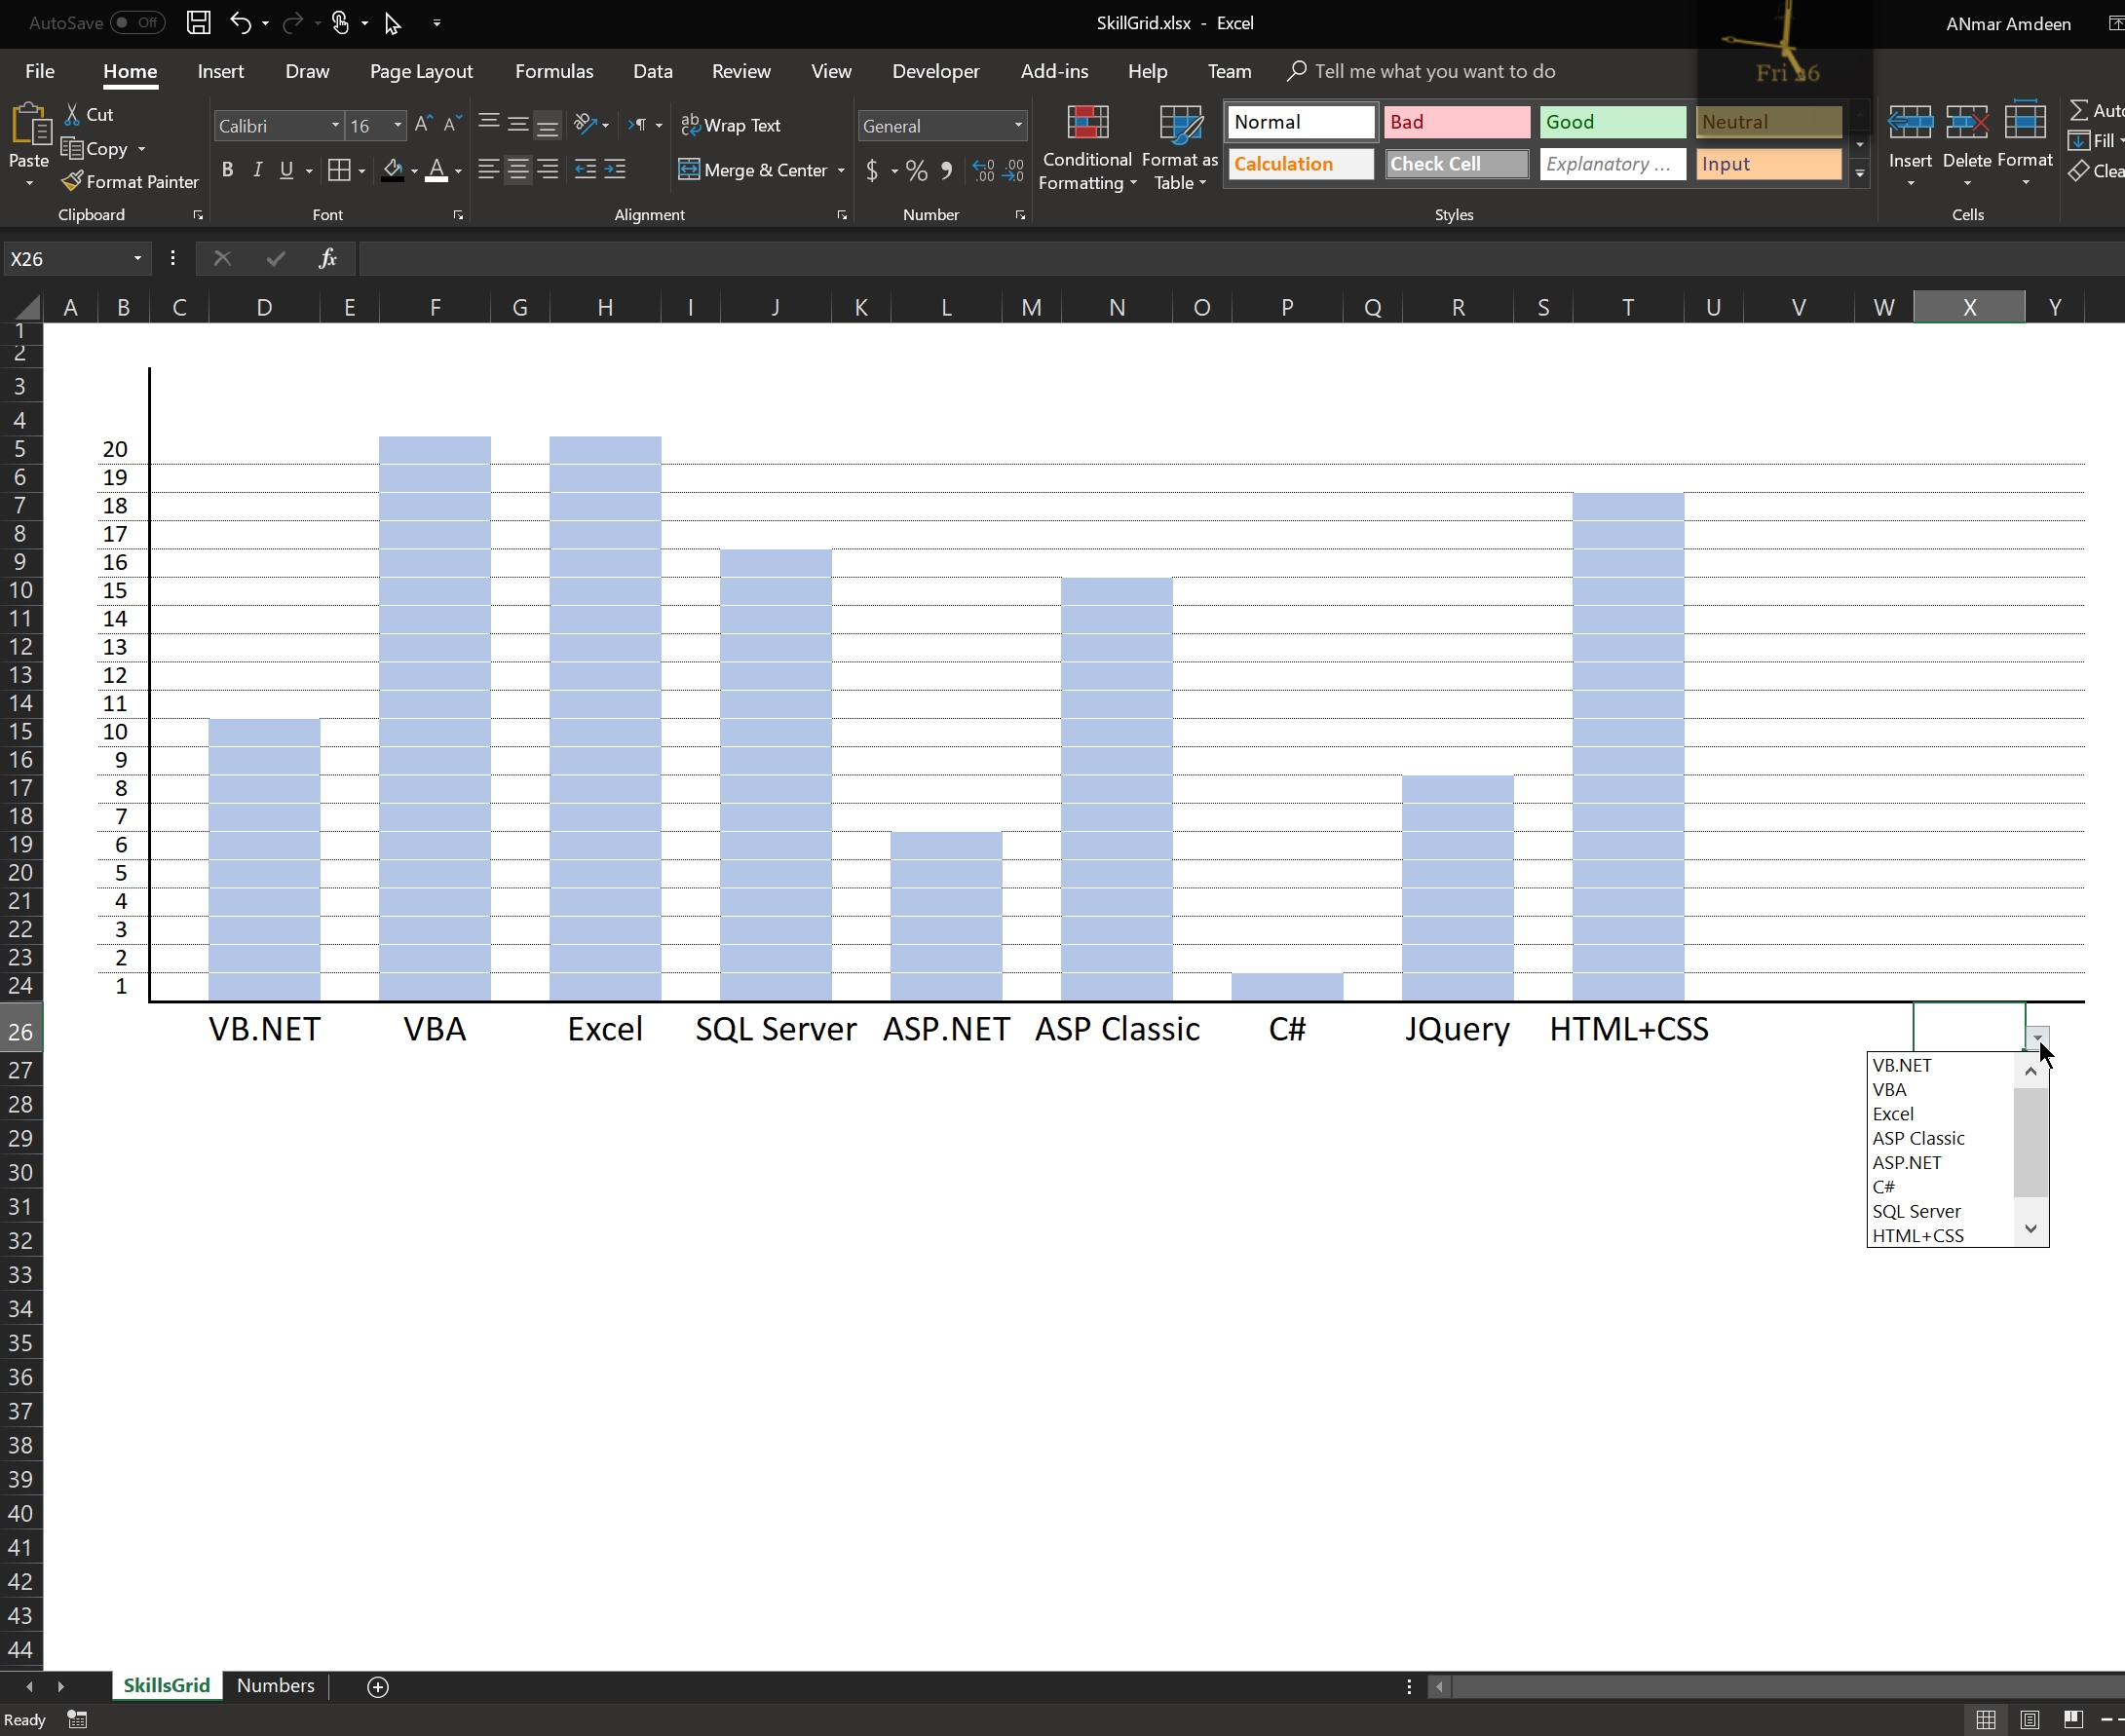
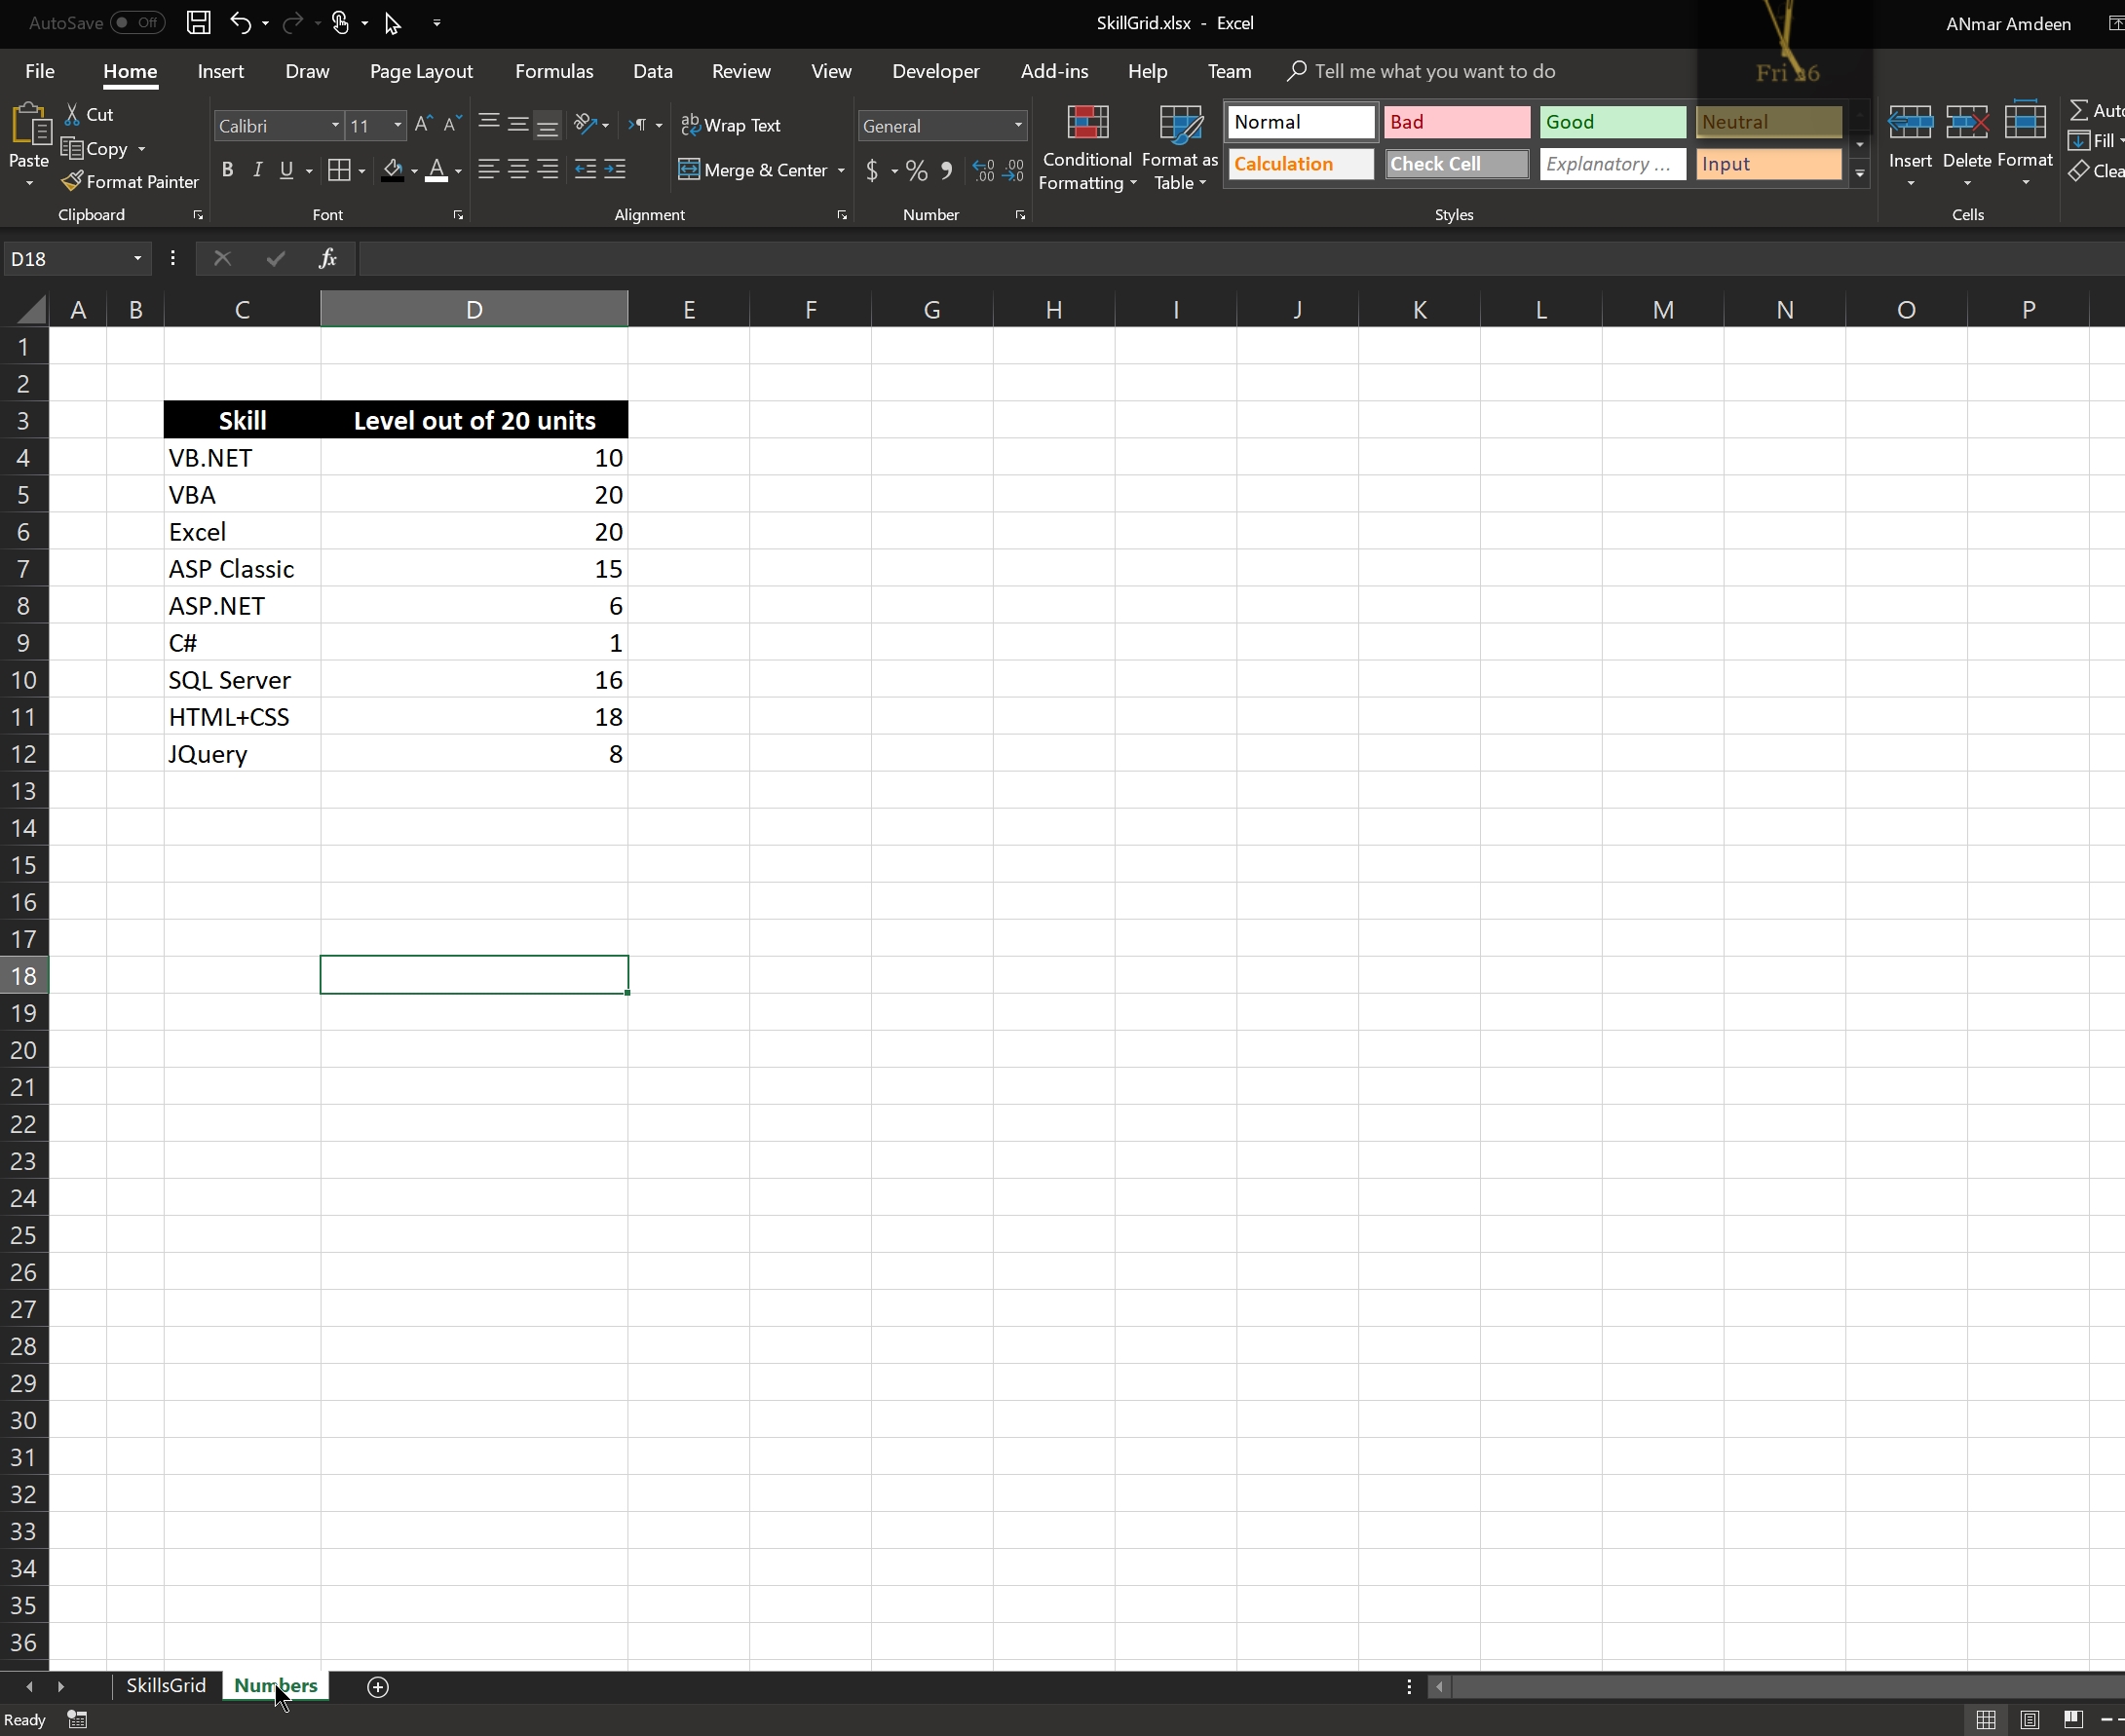
A small Excel file to show how we can create a chart-like Excel sheet
Used in my Resume to show different skill sets and the level of expertise in each
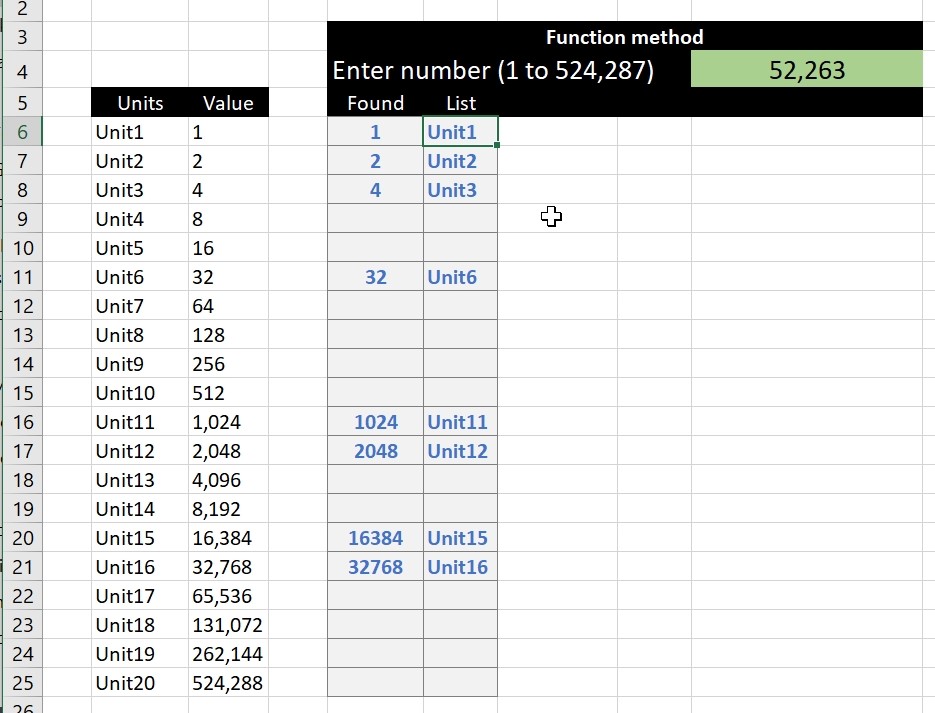
Excel f(x)s = Excel Functions
A small Excel file to show how we can create a chart-like Excel sheet
Used in my Resume to show different skill sets and the level of expertise in each
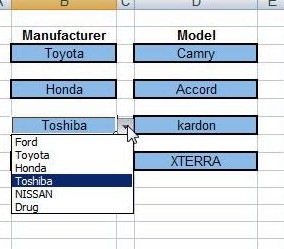
It is to demonstrate how to do multiple validations in the same sheet, or as we want to call it
that depend on each other.
Checking out sheet “Data”, you can tell that Validations on column B is for the heads (Main categories), and on column D is for the sub category of the main that used in column B in that row.
Creating something like this basically falls in three parts
Part1: is the Names you need to define, so after we create the table found “Data” sheet …..

We need to set two names, one for the left-top cell for that table (used as reference) and another name with formula:
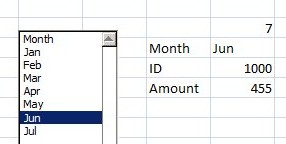
Using Index and CountA Formulas, Names and Forms > ListBox to have a list with connected formulas
Can also be used as form to read from a large table in another sheet
After creating two names, one is “Months” having:
=OFFSET(Sheet1!$B$5,0,0,COUNTA(Sheet1!$B:$B)-2,1)
And the other one is “Month_All” having:
=OFFSET(Sheet1!$B$5,0,0,COUNTA(Sheet1!$B:$B)-2,3)
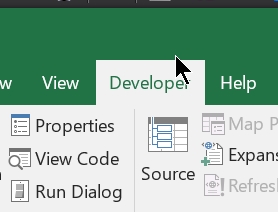
Draw a listbox using “Developer toolbar”, then make its input list as “Months” name we did above, then use these formulas: