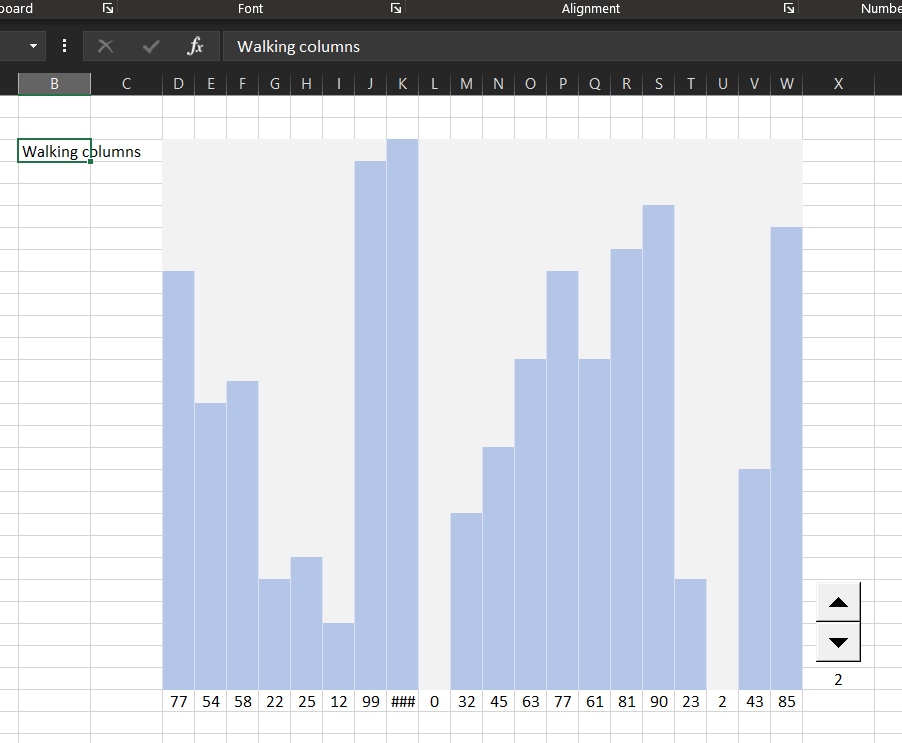
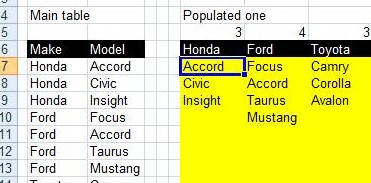
An easy way to scroll through set of data in a graphic way without graphs.
A-pure-formula xlsx workbook. These were done using formulas, conditional formatting, and ActiveX control.
Excel f(x)s = Excel Functions

An easy way to scroll through set of data in a graphic way without graphs.
A-pure-formula xlsx workbook. These were done using formulas, conditional formatting, and ActiveX control.
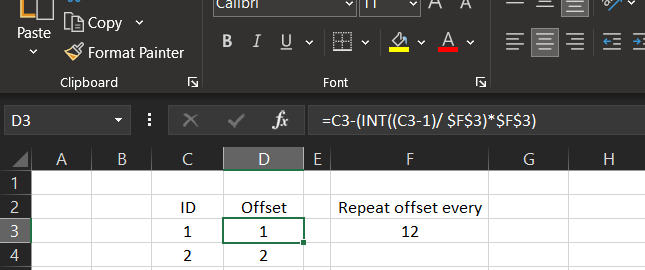
I needed to have an offset of columns to be repeated every 12 months.
This is part of a project, we needed to calculate the coefficient of sales prediction based on the month number, we do have coefficient saved in another table that repeated every year (12 months).
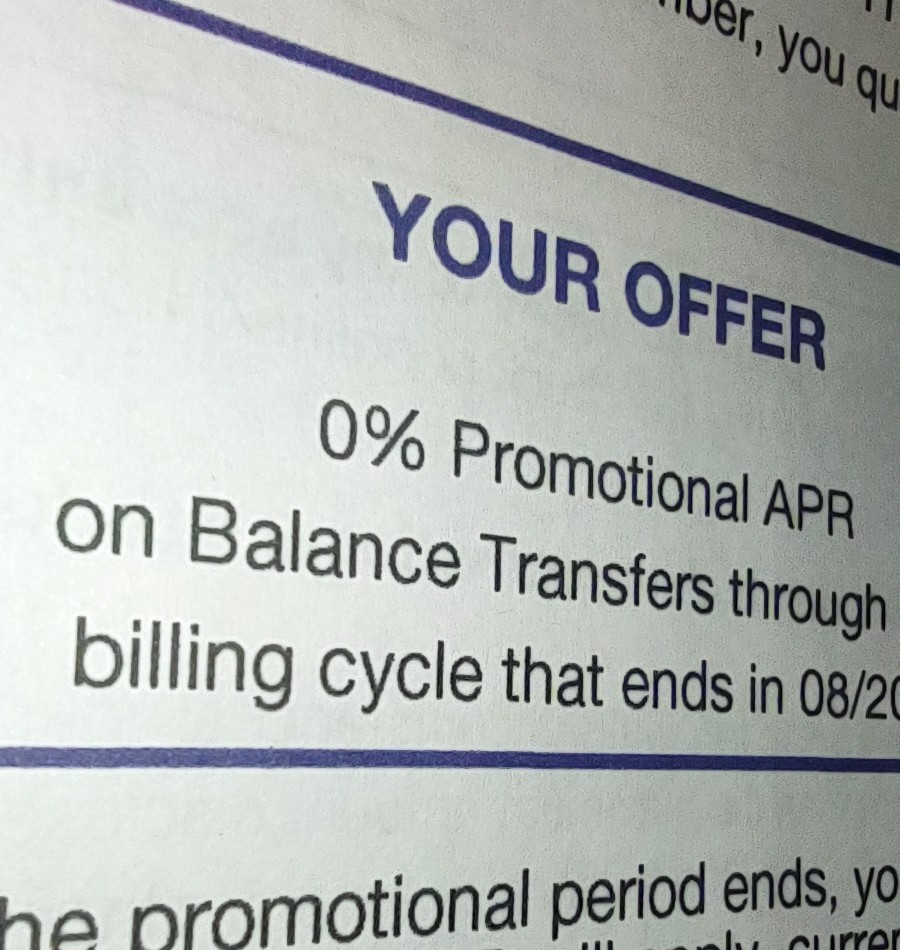
The past few months, I established a formula to help me determine if certain credit card promotion makes sense or not.
This helped me a lot in consolidating my debts (credit card as well others) into interest-free payments. Benefiting from banks and cards promotions. The key part is to determine how much monthly I will commit to pay in order to keep it actually 0%.
So here is the formula.
The function CEILING (CEILING.Math as of Excel 2016) is a very good powerful function.
It allows you to round number to any value up
Unlike ROUND, ROUNDUP and ROUNDDOWN, that are limited to number of decimal places.
CEILING can round to any number, decimal or not.
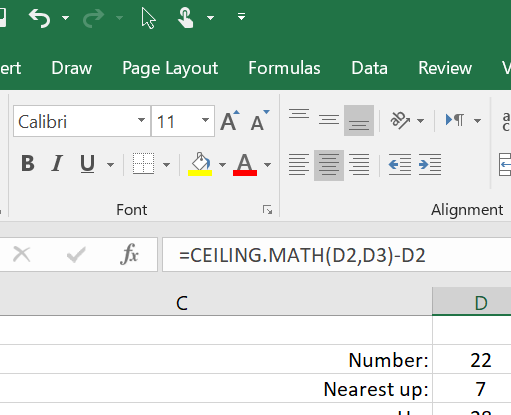
Below is an example of rounding the number in D2 which is 22 into the next 7 up, 7 is in D3, result is 28 as you can see
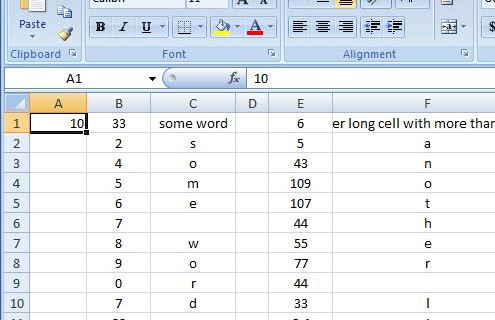
Convert one long column into two
This set of formulas will get the items after row 45 (for example) from column A into the column B starting from B1 to have two 45-rows next to each other instead of one 90-rows column
This was the answer for this question
Yahoo! Answers question http://answers.yahoo.com/question/index?qid=20081225182043AAc7ZEB
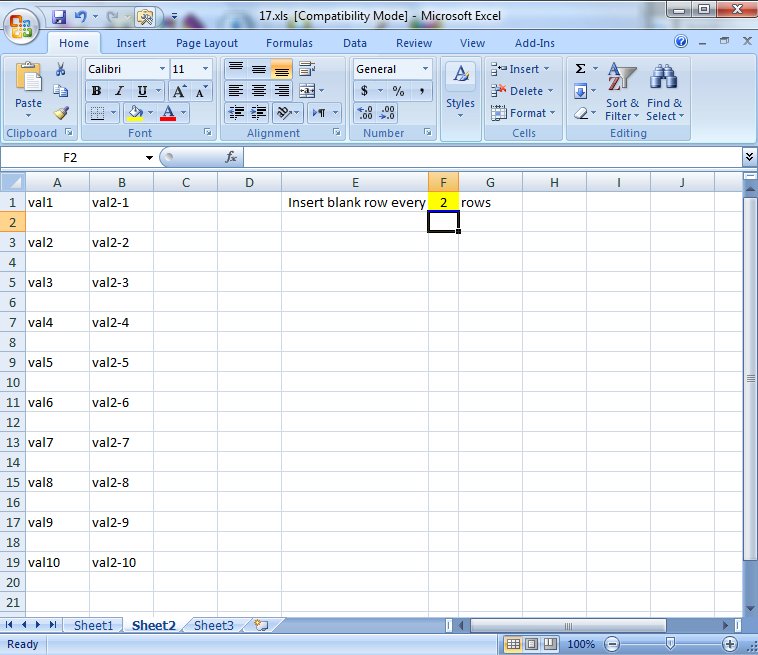
Show two columns in one page as four columns using functions only. This will help you to show the next x number of rows for a certain column to the next of the first one to reduce the number of pages to print.
Here you will see how to work with functions to insert a blank row every certain number of rows in a table using a blank sheet to copy all values of that table into the new sheet Then using Copy > Paste Special to make them constants The new thing is that this is all…
An Excel file that will determine what cash to return to the buyer (How much of each cash unit, or how many of Fifty dollars and how many of Twenty dollars and so on) in a very interesting way using as less functions as needed So, if you need to return 15.45, this file will…
Read More “Change Calculator – calculate change in multiple bills/coins” »
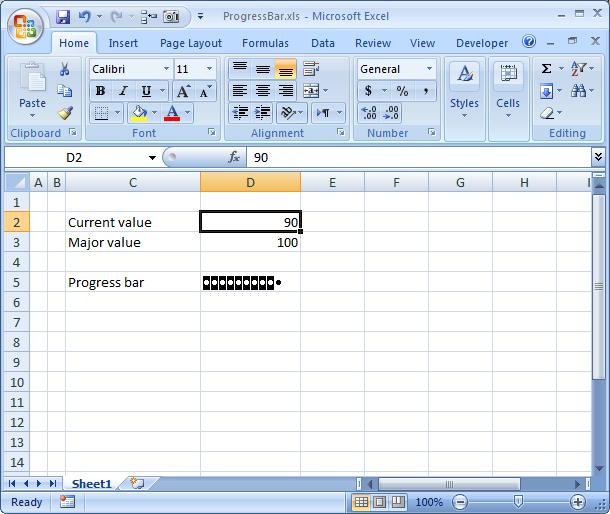
This one is very similar to Tally chart, however, it is for another purpose. It is used to draw a progress bar, yes a progress bar in pure functions, using the formula: =REPT( CHAR( 8),INT( D2/10))&REPT( CHAR( 7),INT( D3/10)-INT( D2/10))
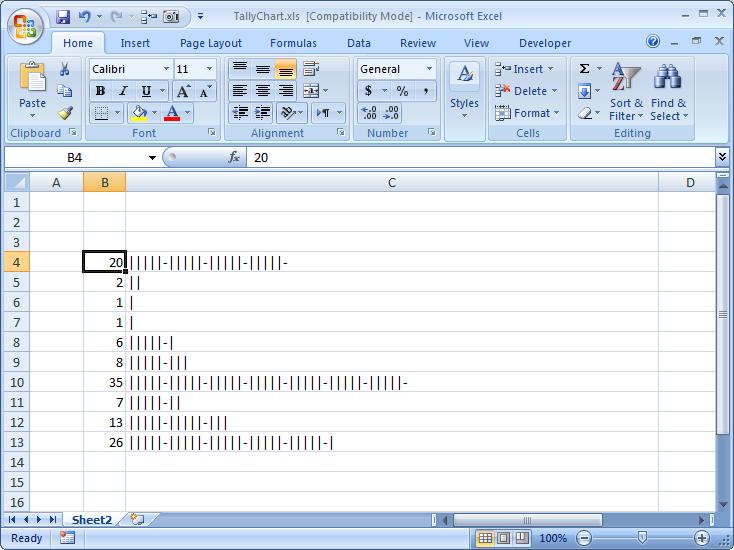
Using a single function can make a graphical view to your number Function is REPT along with IF and INT to show that number in graphical view, formula used here is: =IF(B4<5,REPT(“|”,B4),REPT(REPT(“|”,5)&”-“,INT(B4/5))&REPT(“|”,B4-INT(B4/5)*5))